Adventure with Jaeger and Influx DB

Task at hand
So, it began with a new work assignment. The ask was to setup an observability platform for a cloud based product that can be leveraged to consume the LTM (Logs-Traces-Metrics) of microservices. After some preliminary investigative google searches, and discussions with technical stalwarts, it was decided that we will go ahead with Jaeger to take care of traces.
High-level Design
At a high level, the idea was to deploy Jaeger agent and collector to collect the traces from our microservices and shipping them off to a cloud-based off-premise observability platform. The traces were captured as files, base64 encoded and dumped to a remote server, wherein we decided to hook up Apache Nifi to read in the file content, base64 decode it and pass it on to Jaeger Collector instance running InfluxDB as backend storage (instead of the default Cassandra/ElasticSearch). The off-premise observability stack was to be deployed on a Kubernetes cluster. (I will skip the logs and metrics section for this writeup)
Deployment Options
When it comes to Jaeger deployment there were multiple options or rather I should say strategies. Here’s what the official Jaeger site says around deployment. There were a few good blogs that explained the pros and cons of the various strategies. But to summarize, here’s what we got:
- Deploy Jaeger manually using deployment
- Deploying Jaeger operator
- Deploying Jaeger using Helm charts
Support for Influx DB
Sadly, I would say, our deployment strategies all went for a toss when it came to deploying Jaeger with Influx DB. Jaeger supports external storage using gRPC plugins (this is the one for Influx). There are docker images that bundle jaeger all-in-one with a sample microservice and influx db instance (all running as local processes in a single container) and thus enable the proof-of-concept. But when it comes to production level setup, we couldn’t rely on them. We were able to download the source code for the gRPC plugin, build it and use the compiled binary along with a Jaeger instance but it was’t fitting our deployment strategies. Reason? Jaeger operator didn’t support external storage configuration options when deploying Jaeger. Same for, Helm, it didn’t support the external storage option either.
Experiments we did
Along the way, we kept trying and experimenting. Here’s a summary of what we attempted (sharing the notes):
Experiment #1: Deploying Jaeger all-in-one using Helm charts
helm repo add jaegertracing https://jaegertracing.github.io/helm-charts
helm repo update
helm install <custom-jaeger-release-name> jaegertracing/jaeger
kubectl get pods --all-namespacesexport POD_NAME=$(kubectl get pods --namespace default -l "app.kubernetes.io/instance=jaeger,app.kubernetes.io/component=query" -o jsonpath="{.items[0].metadata.name}")
kubectl port-forward --namespace default $POD_NAME 8080:16686
Once up, we could expose the UI using the following port-forward (we extract the POD_NAME in the first command and use that in the second one):
export POD_NAME=$(kubectl get pods --namespace default -l "app.kubernetes.io/instance=jaeger,app.kubernetes.io/component=query" -o jsonpath="{.items[0].metadata.name}")
kubectl port-forward --namespace default $POD_NAME 8080:16686
Finally, one could view the UI at: http://127.0.0.1:8080/
Experiment #2: Deploying Jaeger using Jaeger operator
helm repo add jaegertracing https://jaegertracing.github.io/helm-charts
helm repo update
helm install <jaeger-operator-custom-release-name> jaegertracing/jaeger-operator
We jaeger operator successfully deployed, we created a deployment.yaml to deploy a jaeger instance. The following was the content of the deployment.yaml:
apiVersion: jaegertracing.io/v1
kind: Jaeger
metadata:
  name: simplest
This deployment.yaml was then deployed using kubectl command:
kubectl apply -f ./jaeger_simplest.yamlThe following pods could be seen up and running:

Experiment #3: Running jaeger all-in-one binary as a process using SPAN_STORAGE_TYPE=rpc-plugin and integrating influxDB as its internal storage (non-K8s approach)
Firstly, download jaeger bundle from https://github.com/jaegertracing/jaeger/releases/download/v1.21.0/jaeger-1.21.0-linux-amd64.tar.gz. Extract it with the below command:
tar -xf <bundlename>.tar.gzYou will see binaries for all-in-one, collector, query, agent in the extracted folder. Next, clone the gRPC Influx DB plugin:
git clone https://github.com/influxdata/jaeger-influxdb.git Build it as described on the page: https://github.com/influxdata/jaeger-influxdb. On a new terminal spin up Influx DB instance, best way to do it is using the standard docker image:
docker run -d -p 8086:8086 -v $PWD:/var/lib/influxdb influxdbCreate tracing db in there, this database will be used later on by the Jaeger client:
docker exec -it <influx-db-container> bash
influx
create database tracing
Finally, to start Jaeger with Influx DB, run this command preferably from the root of the repo cloned above:
SPAN_STORAGE_TYPE=grpc-plugin <path to extracted jaeger bundle>/jaeger-all-in-one --grpc-storage-plugin.binary <root of jaeger-influxdb-dir>/jaeger-influxdb --grpc-storage-plugin.configuration-file <root of jaeger-influxdb-dir>/config-example-v1.yamlJaeger traces itself and hence you will be able to see some traces in the Influx DB after a few minutes:
docker exec -it <influx-db-container> bash
influx
use tracing
select * from span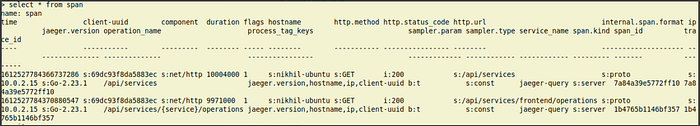
Experiment #4: Running jaeger-query as a container (with storage configured as grpc-plugin) and influxdb as another container
Under jaeger-influxdb repo (the repo that we cloned in Experiment #3), set config-example-v1.yaml as:
influxdb.host: http://influxdb:8086
influxdb.database: tracing
Next, we create a docker network using the command below and use that to launch this container :
docker network create mynetworkWe launch the Influx db as a container on the same mynetwork as below:
docker run -d -p 8086:8086 -v $PWD:/var/lib/influxdb — name influxdb — net=mynetwork influxdbNOTE: It has persistent storage as the PWD is mounted. Moreover, this db instance has traces from Approach 4 captured and will be retained and can be viewed in the database.
Next, we run the jaeger-query docker image and pass in the SPAN_STORAGE_TYPE and GRPC_STORAGE_PLUGIN_BINARY to that container by mounting the current directory onto the container, as shown with the command below:
docker run -d -p 16686:16686 -v “${PWD}:/tmp” -e SPAN_STORAGE_TYPE=grpc-plugin -e GRPC_STORAGE_PLUGIN_BINARY=/tmp/cmd/jaeger-influxdb/jaeger-influxdb-linux -e GRPC_STORAGE_PLUGIN_CONFIGURATION_FILE=/tmp/config-example-v1.yaml — net=mynetwork — name jaeger-query jaegertracing/jaeger-query:latestNOTE: in the command above:
- -v “${PWD}:/tmp” → mounts the current directory i.e. the root directory of jaeger-influxdb plugin repo to the /tmp folder on the jaeger-query container
- it uses our custom defined docker network called mynetwork. This enables it to interact with the Influx DB server.
Conclusion
After all the experimentation, we were not able to figure out a way to deploy Jaeger with Influx DB on a Kubernetes cluster using a deployment strategy (either Jaeger operator or Helm) that matched our product/tech stack requirements. Hence, we decided to drop the plan of using InfluxDB and went ahead with the default database Cassandra with Jaeger.